
CLAYTON, Mo. – Gardeners are familiar with the ubiquitous map that graces the back of seed packages and care labels that accompany most perennials.
That map and its recommendations are receiving an update.
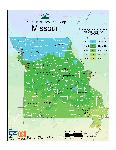
The USDA Plant Hardiness Zone Map advises how plants will fare through the harsh winters with its spectrum that fades from cool purples and blues to greens and oranges.
In the first overhaul of the map in more than 20 years, many areas are finding that warmer winters now allow plants that formerly only neighbors to the south could enjoy.
“People might play around with plants that maybe they wouldn’t have before,” said Nathan Brandt, University of Missouri Extension horticulture specialist for St. Louis County.
Crepe myrtle and bigleaf hydrangea are examples of plants that often die to the ground in Missouri winters. “The new map shows us in St. Louis that we’re slightly warmer than areas to the north and west,” Brandt said. “Perhaps we should try getting away with these plants more often.”
Divided into colored zones, the map represents the average annual lowest temperature at any location. These average lows are a crucial factor in the survival of hardy plants for any given place.
“The extreme annual low temperature in a winter is oftentimes the most important stress factor for a perennial plant, especially in the colder zones,” said Peter Bretting of the USDA Agricultural Research Service.
For many areas, zone boundaries have shifted compared to the 1990 map. Generally, homeowners will find that they occupy a zone that is 5 degrees warmer than in the previous map. St. Louis moved from a 6a to 6b, and Kansas City and Columbia shifted from a 5b to 6a. Missouri ranges from 5b in northern counties – with minimum temperatures averaging from minus 10 degrees Fahrenheit to minus 15 degrees – to 7b in the Bootheel – with minimum temperatures of 5-10 degrees.
That shift comes in part because new maps use average temperatures collected from weather stations from 1976 to 2005, a much longer period than used in the previous estimate. Many winters have also averaged slightly higher temperatures in recent years.
“It’s not a huge trend, but it does show in areas that we’re a bit warmer, so we might get away with more tender plants than before,” Brandt said.
The Internet-savvy gardener will appreciate a much more precise and interactive plant hardiness map to use. With a Geographic Information System-based interactive format, users can enter their ZIP code to find their zone and zoom in on more local detail than in older versions.
Some plants, like apple, lilac and dogwood, could fare worse with warmer winter temperatures because they have a much higher winter chilling requirement in order to produce flowers.
Brandt cautions gardeners to think of all stress factors when choosing new plants for their landscape. Soil health, sun and wind, exposure, humidity, and nearby plants and buildings are all significant factors in a plant’s success.
“Every yard is different, and homeowners don’t want to lose the investments that they put into their landscapes,” Brandt said. “People have to be careful on relying on the data too much because there are microclimates even within a neighborhood or around your own house that can be much cooler or hotter than areas nearby.”
Check out the new plant hardiness zone maps at www.planthardiness.ars.usda.gov.
Read more http://extension.missouri.edu/news/DisplayStory.aspx?N=1330


